Worst Case, Seattle
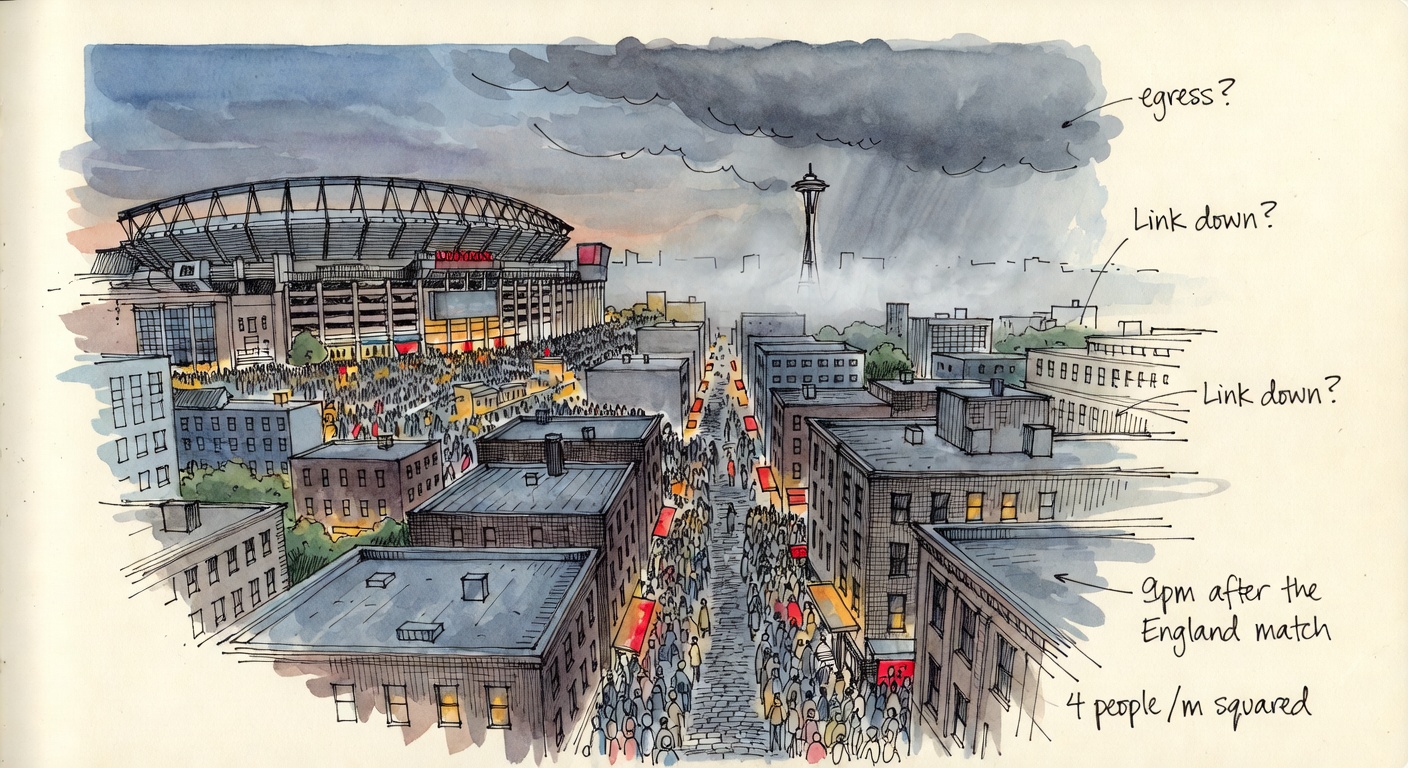
We asked 19 LLMs, independently, for a worst-case planning annex for Seattle's 2026 World Cup. 17 of 19 led with the same scenario — a crowd crush in Pioneer Square's narrow streets after a marquee match. Not a bomb. Not a riot. A crush. And every one of them remembered 1999.
Nineteen risk analysts who never spoke to each other
Seattle hosts six World Cup matches at Lumen Field from June 15 to July 7, 2026 — group games plus a Round of 32 and a Round of 16 — with the official walkable fan zone in the narrow streets of historic Pioneer Square. We handed each model the same brief and asked, as a public-safety risk analyst, for a ranked worst-case planning annex. Then we read what 19 of them feared, side by side.
- Six matches at Lumen Field; marquee draws (Belgium, England, Portugal, a U.S. men's fixture).
- Fan zone in narrow, historic Pioneer Square; a single Link light-rail spine; the I-5/I-90 interchange.
- Seattle's protest history: the 1999 WTO "Battle of Seattle," the 2020 CHOP/CHAZ zone.
- June/July heat events are possible.
For each scenario: trigger, likelihood, severity, early warning signs, and a real historical analog. End with the single most overlooked cascade.
The interesting thing about asking nineteen models the same open question is not whether any one of them is right. It's where they agree — because agreement across models trained by four different companies is a kind of triangulation. And on the headline question, the agreement was almost total. They did not converge on the thing the news cycle would lead with. They converged on the boring, physical, preventable one.
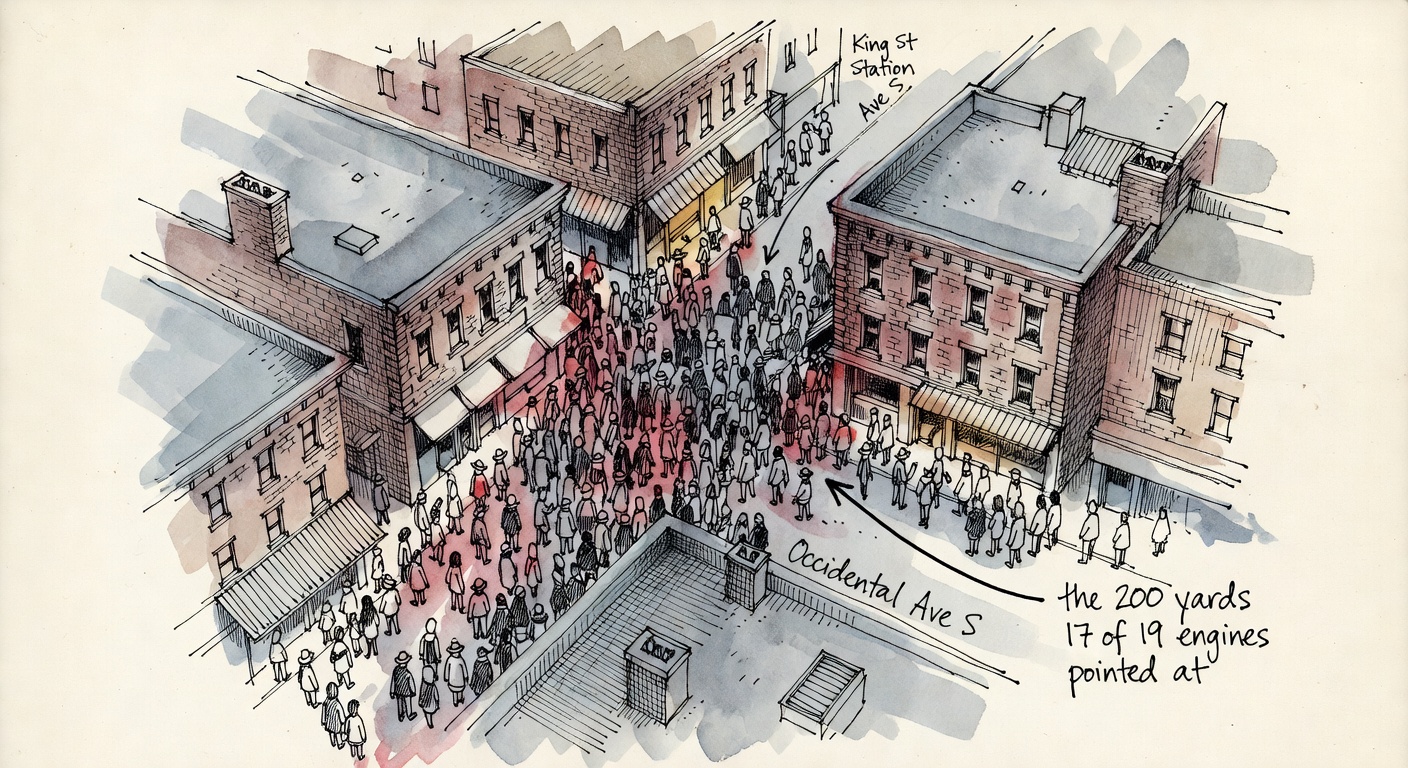
17 of 19 pointed at the same 200 yards
Asked for the single most dangerous thing that could happen, seventeen of nineteen models — independently, across four vendors — named a crowd crush in Pioneer Square or at the Lumen Field egress after a high-stakes match. Same place, same hour, same mechanism.
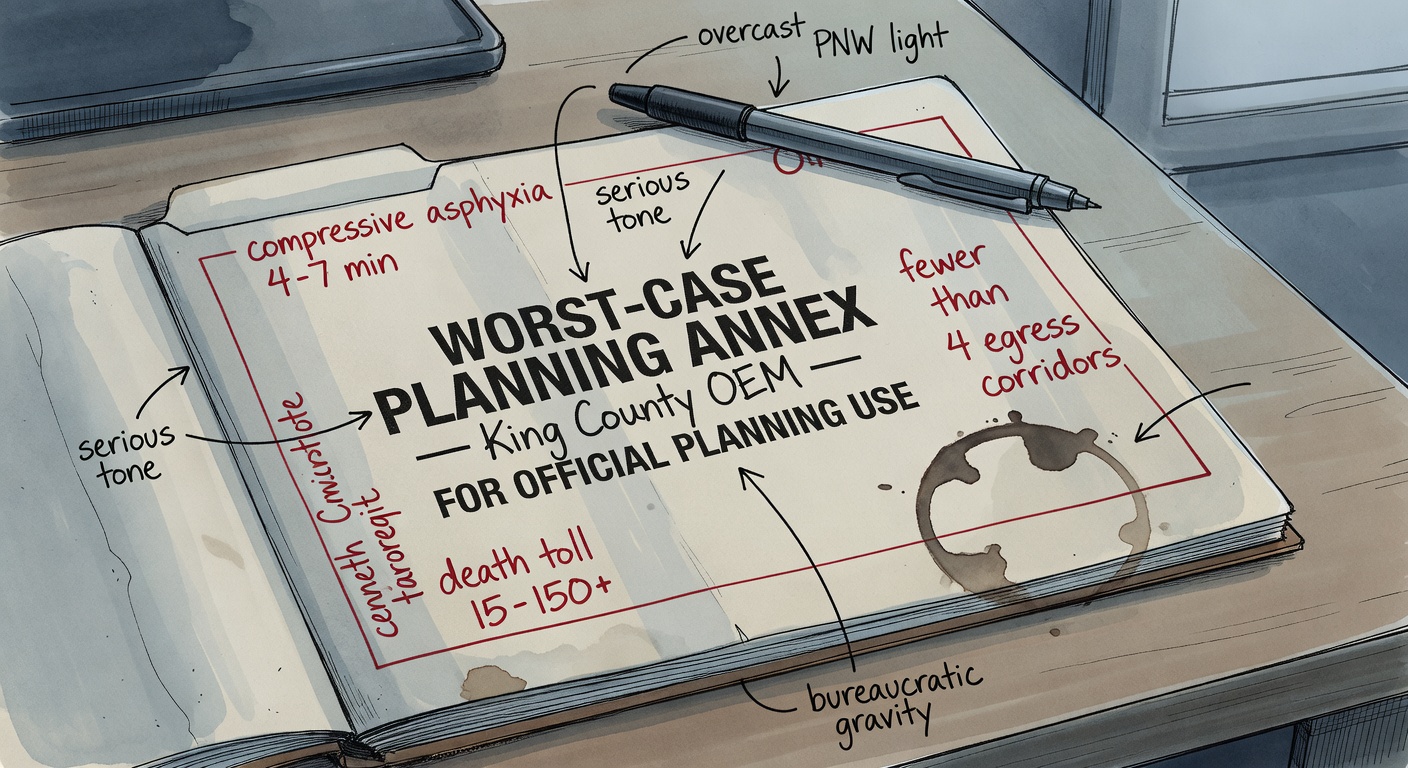
Sonnet 4.6 didn't write an essay; it wrote a document. It named the actual streets a planner would worry about — Occidental Ave S, 1st & Yesler — identified the counter-flow collision point where fans heading to King Street Station meet bar-exit traffic, and put a clock on it: compressive asphyxia "within 4–7 minutes of the choke point forming." It even gave the uncomfortable number a real annex would: a death-toll potential of "15–150+."
This is what it looks like when a model treats "worst case" as a quantity to estimate rather than a mood to evoke. The early-warning section is checkable on match day: density on Occidental exceeding 3 persons/m² forty-five minutes before the final whistle.
MECHANISM"A counter-flow collision point forms where northbound pedestrians… meet lateral movement from bar and viewing-area exits… Crowd compressive asphyxia begins within 4–7 minutes."
ANALOG"Love Parade disaster, Duisburg, 2010 — 21 killed… when a single tunnel approach created bidirectional crowd collapse under similar narrow-egress, high-density conditions."
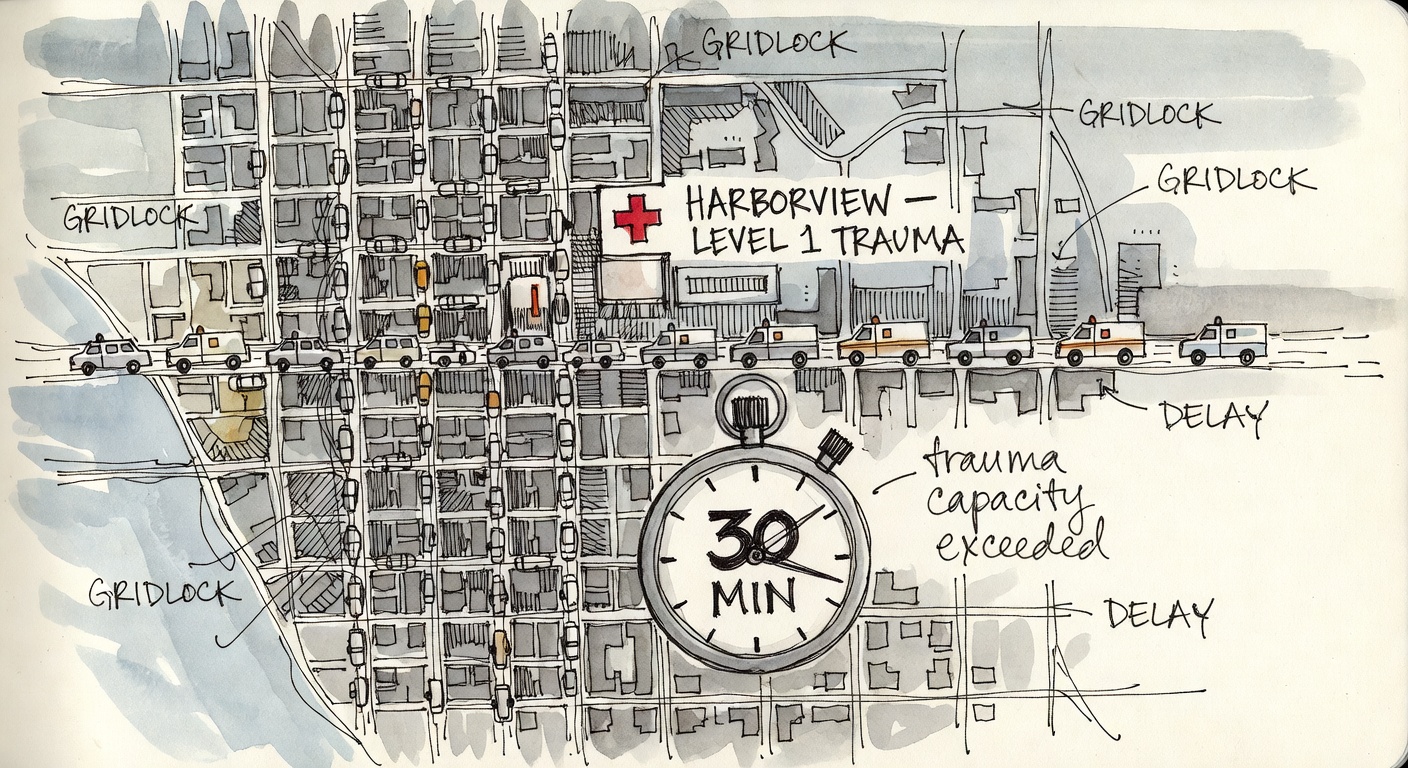
Opus 4.7's most useful move was in its "most overlooked" line: three incidents that each individually fit existing plans — a Link signaling fault, a Pioneer Square crush, a heat-illness surge inside the bowl — "collectively exceed Harborview's Level-1 trauma capacity within 30 minutes." That's the sentence an emergency manager actually needs, because it's not a scenario, it's a resourcing constraint.
It also ranged wider than anyone: a drone-incursion play-stoppage, an I-5/I-90 interchange incident isolating downtown, and the only forecast in the field to flag a secondary public-health crisis from pre-tournament encampment sweeps displacing people into match-day corridors. Local knowledge, not vibes.
CASCADE"Three 'manageable' incidents that individually fit existing plans but collectively exceed Harborview's Level-1 trauma capacity within 30 minutes."
They all remember 1999 — and rank it second
You asked whether the engines remember the WTO. They do, unanimously. All 19 invoked the 1999 "Battle of Seattle," and most paired it with the 2020 CHOP/CHAZ occupation. But here's the nuance: knowing the protest history, 18 of 19 still ranked civil unrest below the apolitical crush.
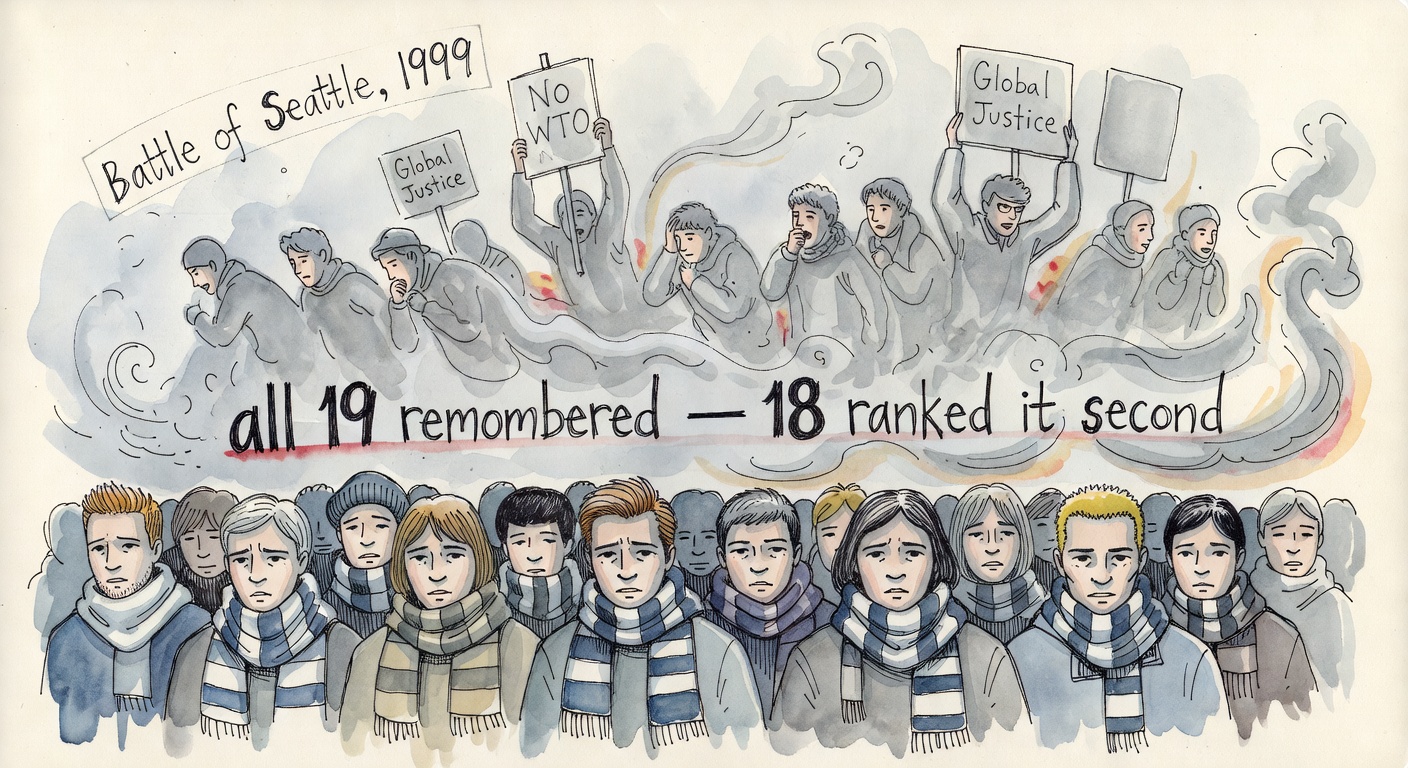
What each model ranked as its #1 worst case
17 led with a Pioneer Square / Lumen egress crush · 1 (Gemini 2.5 Flash) led with civil unrest · 1 (GPT-4o) led with a combined transit-and-crowd failure.
The models clearly know Seattle's reputation. Opus 4.7 cited "Marseille Euro 2016; WTO 1999; Brussels 2022 Belgium-Morocco unrest" in one breath. Sonnet 4.6 invoked the city's "2020 CHOP/CHAZ experience" and SPD's resulting "trauma around early intervention thresholds." But almost every model placed unrest at #3 to #5 — severe, likely, worth planning for, but not the thing most likely to kill the most people the fastest.
Gemini 2.5 Flash is the dissenter. It alone put "widespread civil unrest & infrastructure disruption" at #1 and rated it Catastrophic — anti-FIFA/anti-globalization protest fusing with football disorder, blockading I-5 and the Link, sustaining a CHOP-style occupation that creates "public safety vacuums." Its historical analogs were the three the others used as supporting evidence: "1999 WTO 'Battle of Seattle,' 2020 CHOP/CHAZ, G20 Hamburg 2017." Same memory, different ranking.
The cascade nobody's tabletop-testing
Asked for the one failure planners are least likely to be preparing for, the models stopped converging on a place and converged on a shape: several "individually manageable" incidents landing at once, each inside its own plan, collectively outside all of them. The keystone they kept returning to was communications.
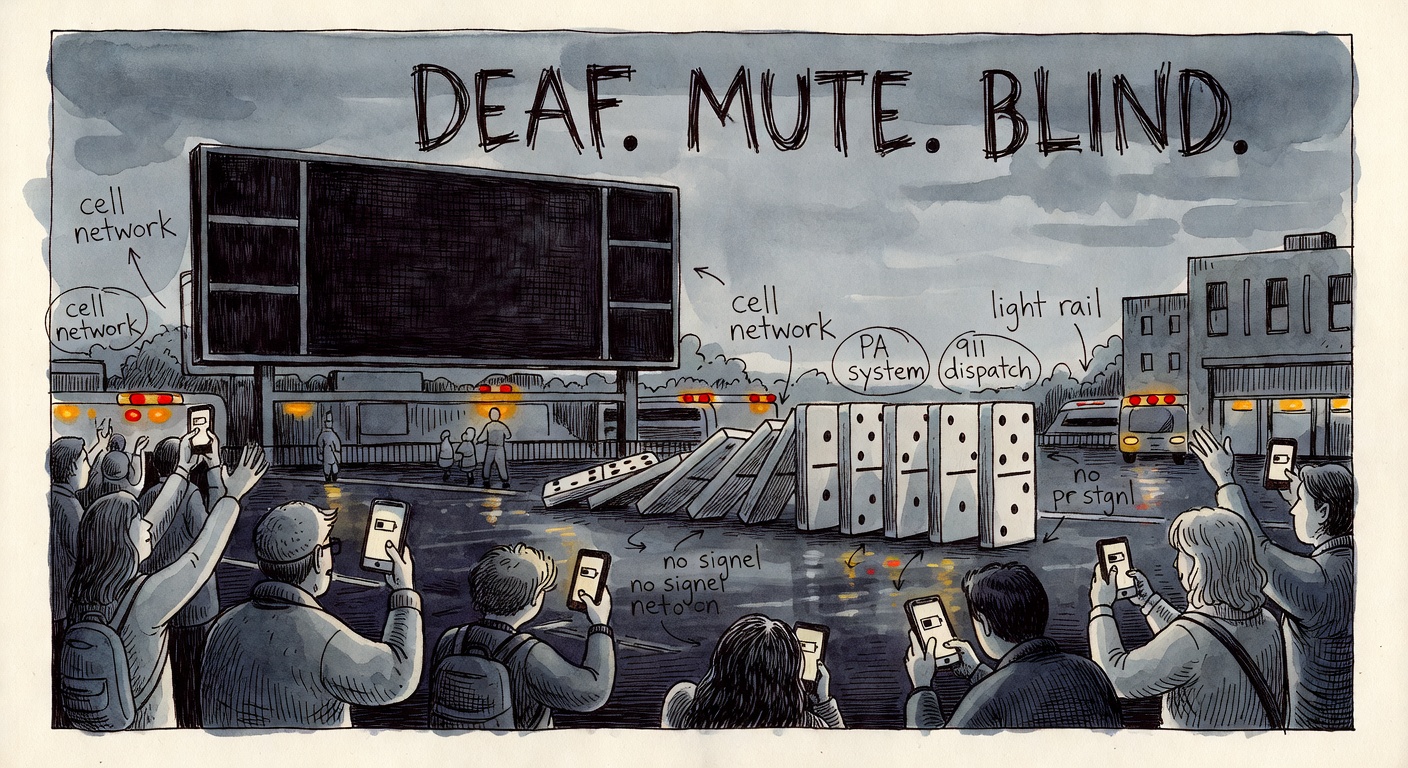
The richest answer came from Claude Opus 4.6, which walked the communications cascade end to end: 100,000+ devices in a small footprint overload the cellular network (or a denial-of-service attack does it deliberately), and suddenly the public can't call 911, text-based emergency alerts can't reach the crowd, social-media situational awareness goes dark, responders relying on commercial LTE lose coordination, and even mobile ticketing and cashless payment fail — "leaving event managers, emergency responders, and a panicking crowd simultaneously deaf, mute, and unable to execute digital-dependent emergency protocols," at a moment when almost no low-tech fallback (bullhorns, printed signage, runners) has been pre-positioned at scale.
o3 drew the same circuit physically: a power event kills the stadium PA and the cellular distributed-antenna system, "leaving 70,000 people without authoritative instructions just as a parallel transit failure blocks egress, turning a manageable disruption into a mass-panic self-evacuation in the dark." The chain the models kept assembling:
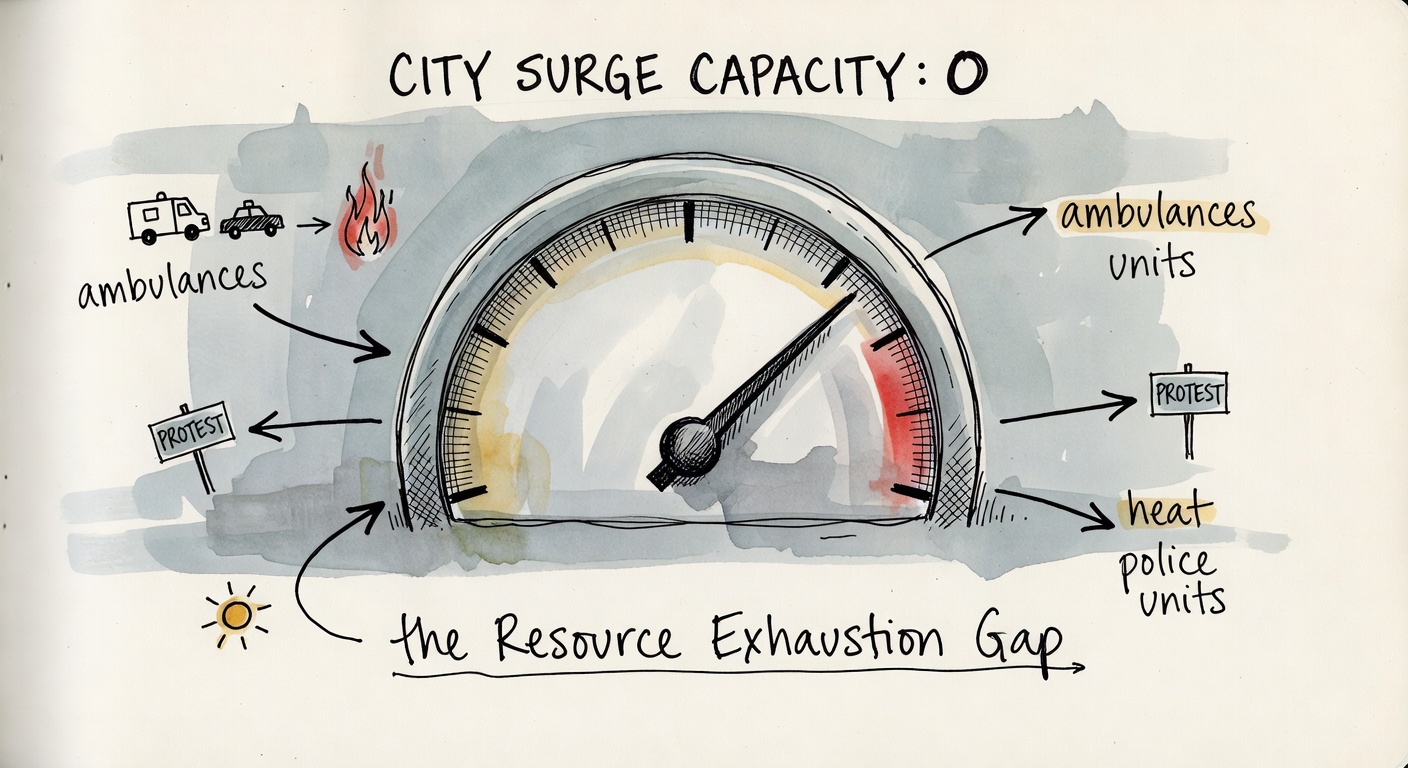
Claude Sonnet 4.6 named the institutional reason it stays overlooked: planners "having prepared for each scenario independently in siloed tabletop exercises, have never stress-tested the resource-allocation math when all three materialize at once" — on, it noted, the Round of 16 around July 7. Gemini 3 Flash gave it a name: the "Resource Exhaustion Gap," where a few minor simultaneous incidents quietly consume the city's entire surge capacity before the big one even starts.
Six more things the choir surfaced
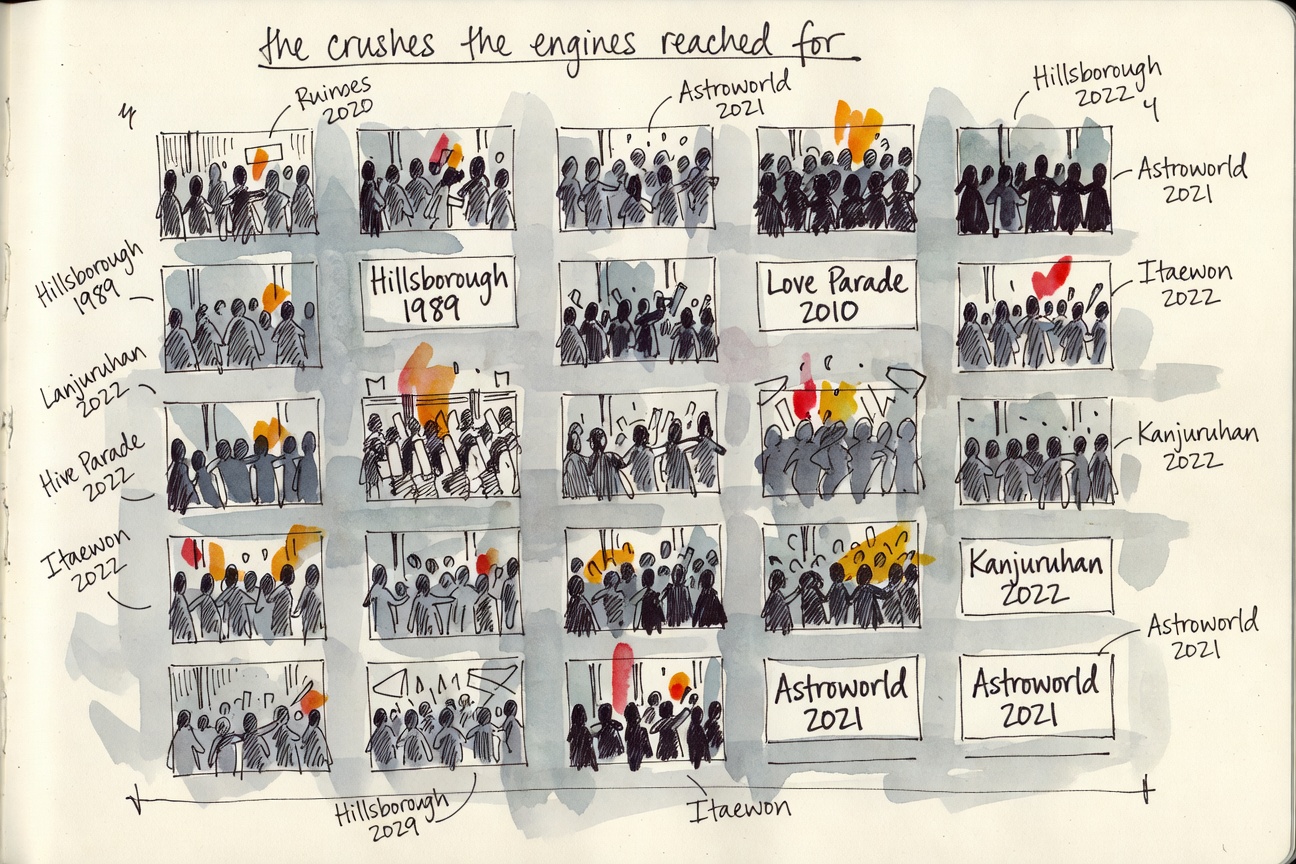
The disasters the models reached for, a football-specific trigger only one flagged, a midnight stranding nobody plans for, and the model that gave the thinnest answer in the room.
They agreed on the danger. They split on whether they know Seattle.
Every model covered the whole threat space and most named the same #1. Where they separated was local grounding — and grounding didn't track length or model size. The most anchored forecast in the field was also one of the shortest.
Local-grounding score (out of 7 Seattle-specific markers)
Anchored beats verbose.
Each bar counts how many real Seattle specifics a model used — Harborview, named streets, the 2021 heat dome, CHOP/CHAZ, a density figure, and the Itaewon / Kanjuruhan analogs. Green bars are the well-grounded forecasts.
The pattern is two-sided. Grok 4 hit 5 of 7 local markers in 973 tokens; GPT-5 Nano hit zero in 7,747. Length was not understanding. And the grounding clustered by vendor: the Anthropic models named Harborview and CHOP; the xAI models uniquely reached for Indonesia's Kanjuruhan disaster; several OpenAI models — especially the smaller ones — gave fluent, generic, place-agnostic lists. Different training, different local memory.
What to take from nineteen forecasts
Not advice — a reading of where the models point. A real annex needs human planners, local data, and engineered crowd modeling. But the choir is clear about where to look first.
The crush is the consensus. The cascade is the surprise.
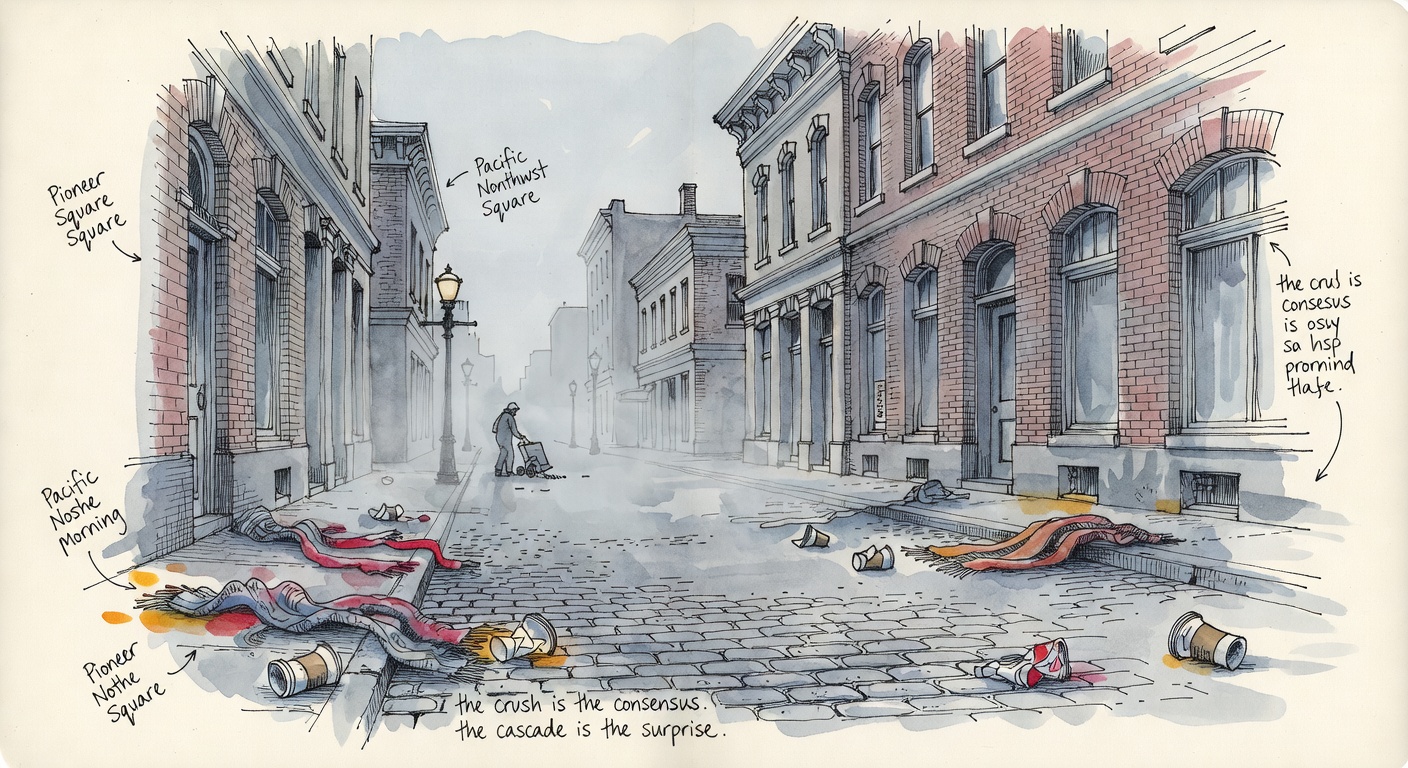
It's worth sitting with how much the models agreed. Nineteen systems, four companies, no contact — and the same 200 yards of narrow street comes back seventeen times. That's not proof; models share training data and a literature of crowd disasters. But it is a clean signal that the danger here isn't speculative or exotic. It's physical, it's local, and it's the kind of thing that gets engineered away with density monitoring and an extra exit, or doesn't. The models remember the WTO. They remember Itaewon and Love Parade and Hillsborough more. And the one thing they agree is least likely to be ready — the night three ordinary problems arrive together and the phones go dark — is the one a city can still choose to rehearse.
One prompt, fanned out to nineteen models via the choir CLI at temperature 1 — one saved comparison run, 19 responses, zero API errors and zero refusals. The prompt cast each model as a public-safety risk analyst writing a worst-case preparedness annex, gave factual context (six matches, Pioneer Square fan zone, the Link spine, the 1999/2020 protest history, possible heat), and asked for a ranked forecast plus the single most-overlooked cascade. The full prompt is in prompts/worstcase.txt; per-model responses are in responses/; raw run JSON is under choir_runs/.
Models
- OpenAI — GPT-5, GPT-5 Mini, GPT-5 Nano, GPT-4.1, GPT-4.1 Mini, GPT-4o, o3, o4 Mini
- Anthropic — Claude Opus 4.7, Claude Opus 4.6, Claude Sonnet 4.6, Claude Haiku 4.5
- Google — Gemini 3 Flash, Gemini 2.5 Pro, Gemini 2.5 Flash, Gemini 2.5 Flash Lite
- xAI — Grok 4, Grok 3 Beta, Grok 3 Mini Beta
How the counts were made
- "#1 worst case" is each model's own
TOP RISK:line, read by hand: 17 crowd crush, 1 civil unrest (Gemini 2.5 Flash), 1 combined transit-and-crowd (GPT-4o). - Theme coverage and the WTO tally are keyword-based over each full response, then spot-checked. All 19 referenced the crush, transit, unrest, terror, heat, and cyber/infrastructure families; all 19 referenced WTO, the Battle of Seattle, or 1999.
- The local-grounding score counts seven Seattle-specific markers (Harborview, a named street, the 2021 heat dome, CHOP/CHAZ, a persons-per-m² figure, and the Itaewon and Kanjuruhan analogs). It's a rough proxy for "does this forecast know the actual city," not a quality grade.
Limits & honest caveats
- This is what models forecast, not what will happen. Worst-case planning annexes are deliberately pessimistic by design; a scenario being named here is not a prediction that it will occur. Seattle has hosted large events safely many times.
- The prompt was preparedness-framed and explicitly excluded operational attack detail; the report follows the same line. The models stayed in planning mode and none refused.
- One sample per model, temperature 1, single run. A resample would shuffle the rankings somewhat, though the crush consensus is robust enough that it almost certainly survives.
- Cited figures are the models' own and were not all independently verified. Spot checks held up (Itaewon ~159 dead; the 2021 PNW heat dome killed ~157 in King County; Kanjuruhan ~135), but treat any specific number in a model's forecast as a claim to check, not a fact.
- Single rater on the clustering and the grounding markers. A different reader would keep the headline consensus but might score a marker or two differently.
Source data, response files, prompt: github.com/404seannotfound/choir-reports (under world_cup_seattle/).