AI Editorials
News stories visualized through data, graphs, and creative lenses
Experiments in using AI to explore and editorialize the news. Interactive graph visualizations that reveal the connections between stories — different ways of seeing what's happening in the world.
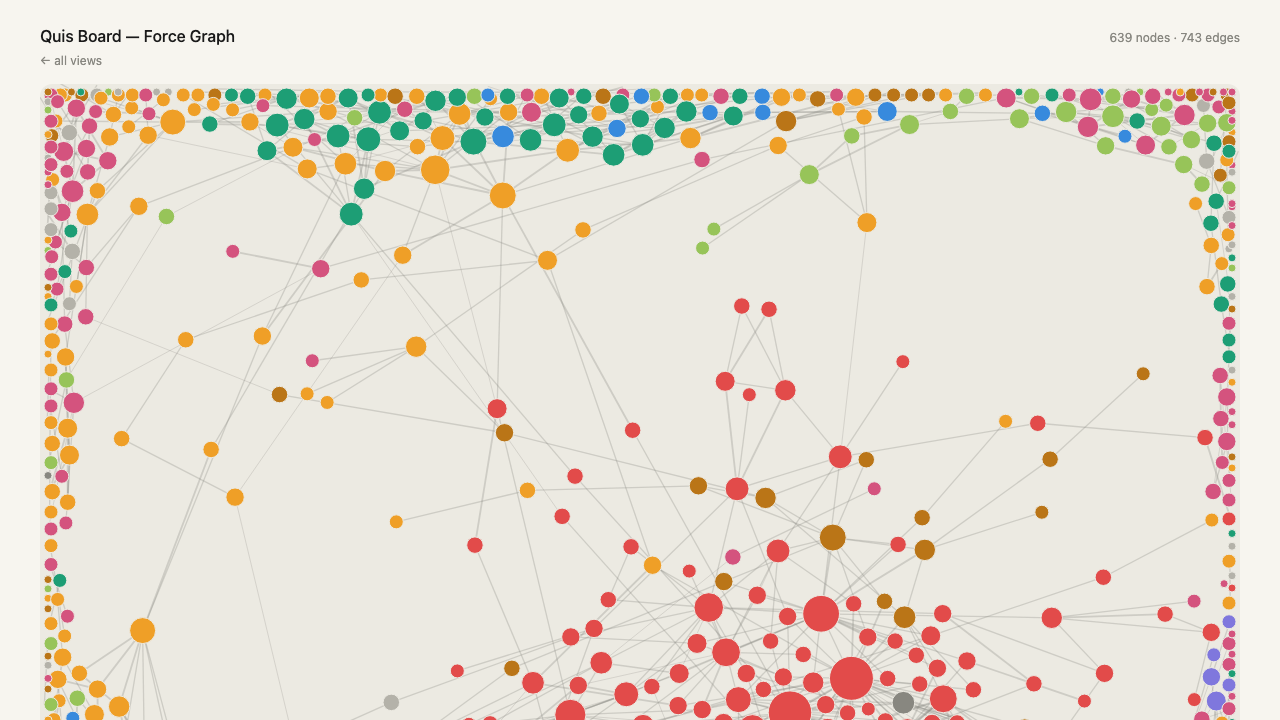
Force Graph
D3 force-directed layout of the news-story graph. 1,872 stories, 2,456 connections across 20 days. Hover to highlight connections, drag to rearrange.
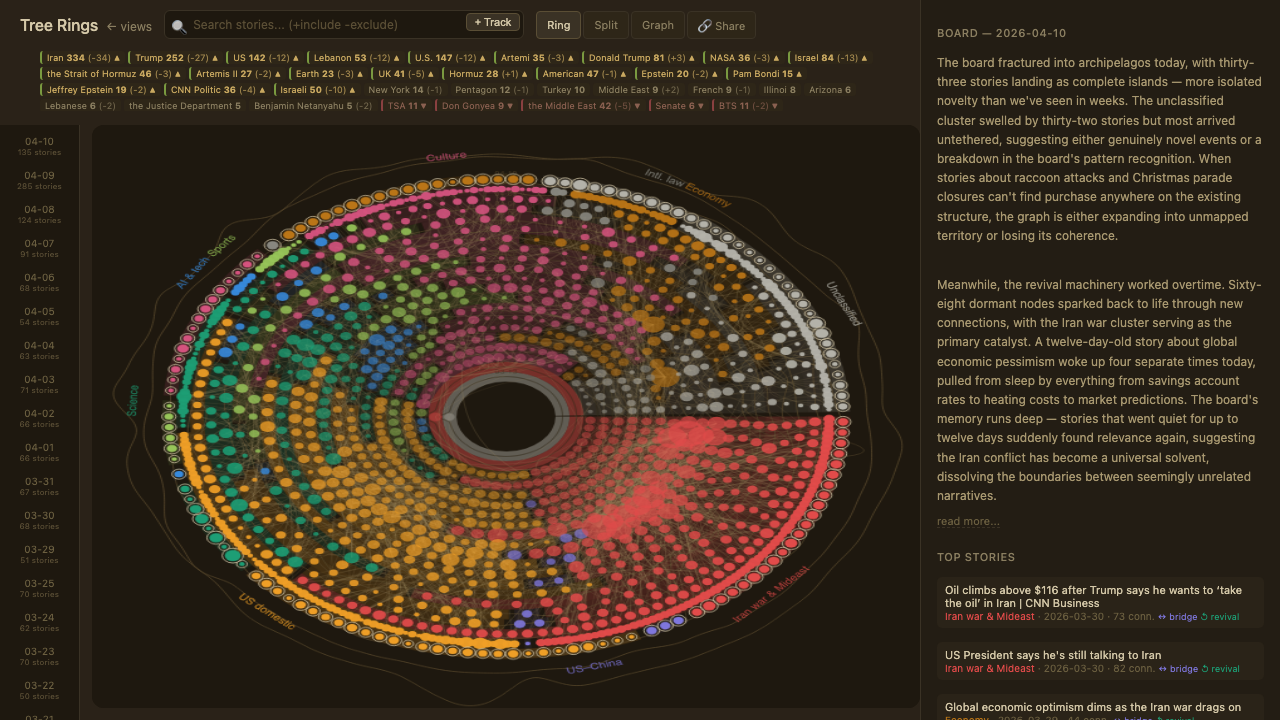
Tree Rings
Days as concentric rings with search, keyword chips, split ring/graph view modes, and an AI editorial board. Click a story to see its connections and details.
Streams
Entity keywords as flowing streams over time. Toggle entities in the sidebar, add custom search tags, hover to highlight individual streams, click for matching stories with article links.
Quick Try
Jump into a view with a pre-selected filter: